Chapter 3
Description of the energy system
Chapter 3
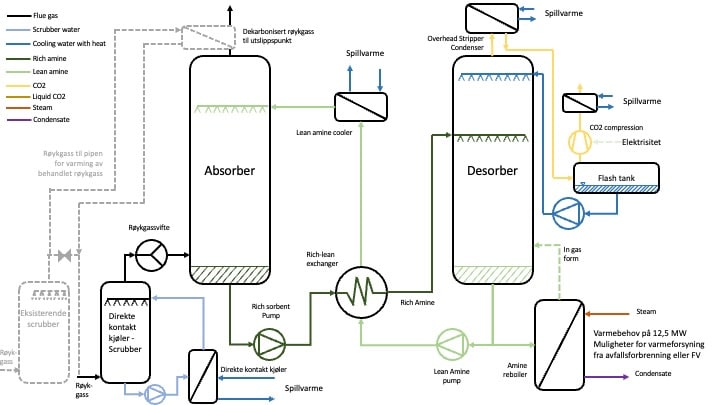
The capture plant "KAN Referansa" is an amine-based capture plant, with four heat exchangers heat can be obtained from, and one heat exchanger heat is supplied to.
2.1 Key figures for "KAN Referansa"
- Waste: 100,000 tons/year of waste and 100,000 tons/year of captured CO2
- Continuous operation – 8000 hours per year
- The plant produces steam at 40 barg and 400°C which is converted into electricity and district heating.
- Excess heat from the turbine is cooled in the summer, the plant has the capacity to cool all the heat that goes to district heating in winter in dry coolers.
2.2 Key figures for the district heating network (DH) to which the reference plant "KAN Referansa" delivers:
- The annual heat demand for DH is 200 GWh, "KAN Referansa" supplies 175 GWh of these as base load in the district heating system from steam downstream turbine.
- The minimum power requirement throughout the year is approximately 6.5 MW.
- The district heating network operates with a return temperature of 90/60 °C. In periods (winter), the return trip may be somewhat higher. The maximum heat delivery from "KAN Referansa" is 28.75 MW without a carbon capture plant, this corresponds to 844 m3/h at 60/90 °C. It is assumed that this quantity is constant.
- 60/90 °C is assumed even though several plants will have a higher trip temperature and a lower flow. Higher trip temperatures and lower flow can lead to changes in COPs presented as well as other heat pump technologies applicable. Most DH networks aim to lower both return and return temperatures, which is why 60/90 °C has been chosen as a somewhat future-oriented temperature level.
- There are possibilities of accumulation up to 110 °C, but this is little used.
2.3 The capture facility
Key figures for the capture plant (CC) intended for "KAN Referansa", which is based on an amine plant, as it is most widespread.
- Heat demand (steam) of 12.5 MW, equivalent to 100 GWh per year to reboiler.
- The total cooling demand is 20.2 MW, approx. 617 m3/h between 55/25 °C, corresponding to 162 GWh/year, distributed as follows:
- Direct Contact Chiller (DCC) (8 MW)
- Lean amine cooler (7.5 MW)
- OH capacitor (3 MW)
- CO2 compressor (1.7 MW)
- The cooling water will probably often have a higher minimum temperature, 25 °C is selected to show how one can solve the challenges of temperatures lower than outside temperatures.
- The possibility of direct cooling against district heating is approximately 2.6 MW, corresponding to 21 GWh/year.
- The total need for electricity is 3 MW (2 for compression, 0.5 for pumps and the like and 0.5 for flue gas fans and the like).
Waste heat must be cooled away continuously.
"KAN Referansa" has 20.2 MW of waste heat that must be cooled continuously. It is important to consider how to recover as much of this waste heat as possible, as well as what to do with the waste heat when you cannot recover it, and how to get rid of it best.
2.4 Variations in heat demand in the district heating network
The seasonal variations of the district heating network will be important to define, as heat utilization from the capture plant will depend on how much can be delivered to the DH network.
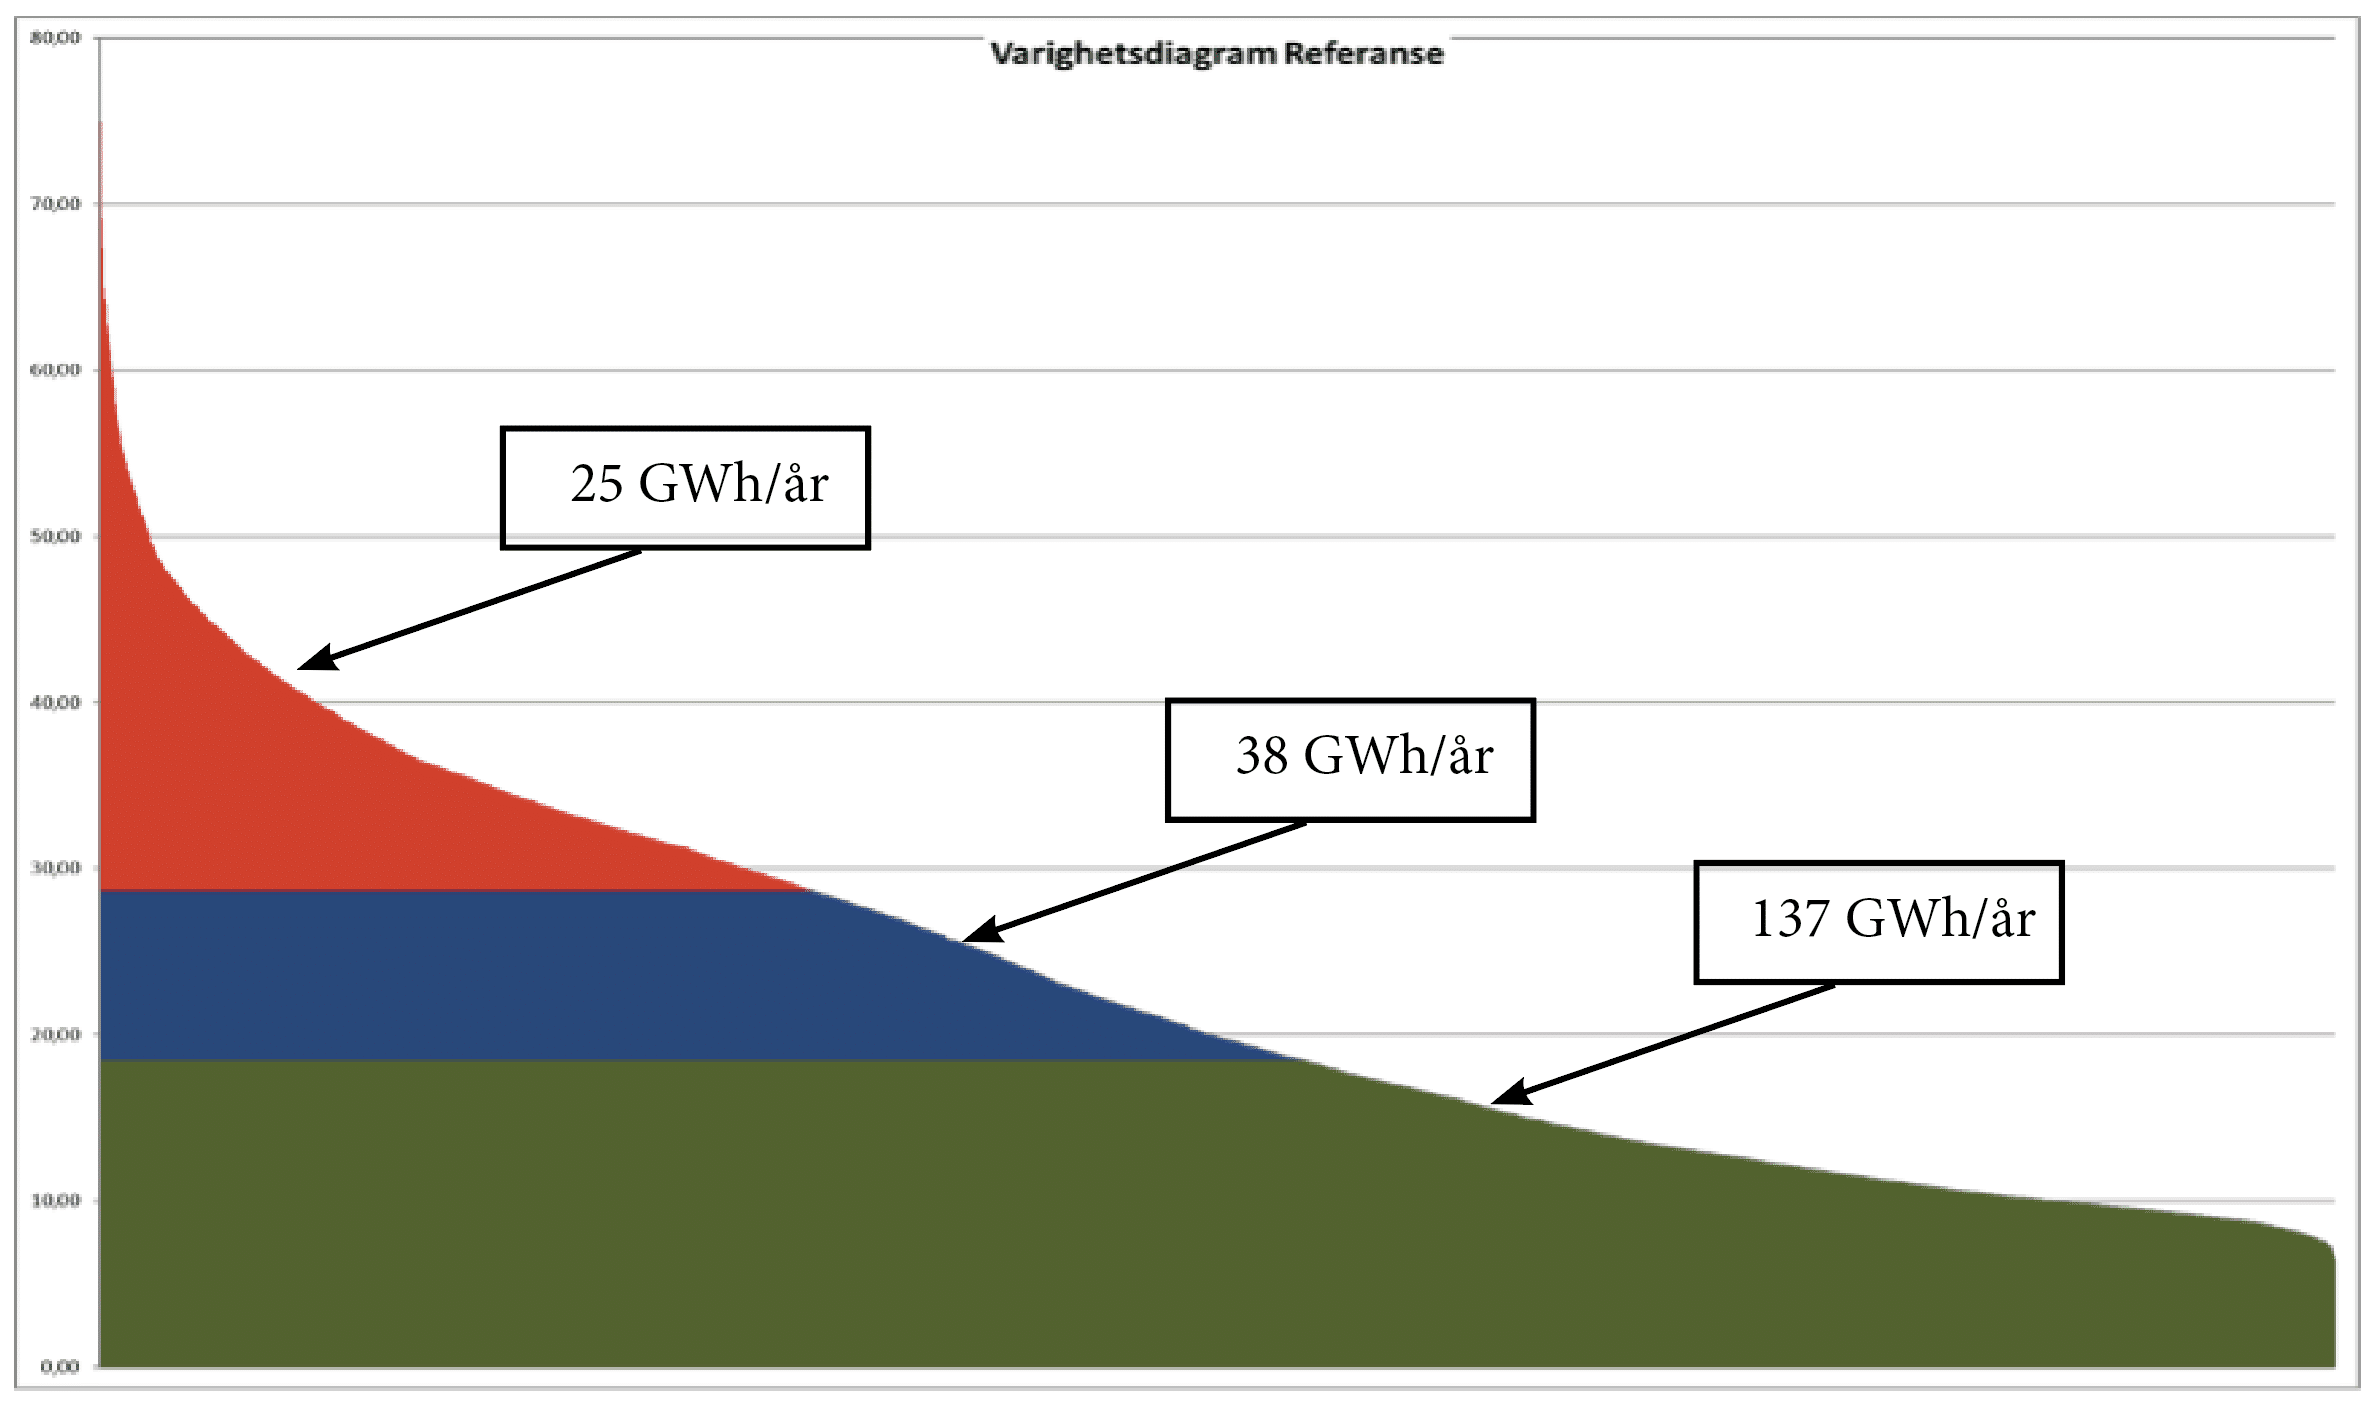
The figure above shows an example of a variability curve for the fictitious district heating network of "KAN Referansa". The basket is made by extrapolating the hourly values from a district heating network in Norway. The figure shows the peak load hour (coldest hour) on the left, with other values sorted in descending order towards right. The green area corresponds to the DH capacity of the waste incineration. The red area is the peak load supplied by alternative heat sources, when the heat demand of DH exceeds the waste incineration plant's DH capacity. The distinction between green and red areas is 28.75 MW. It is worth noting that there is a certain heat demand throughout the year, minimum load about 6.5 MW.
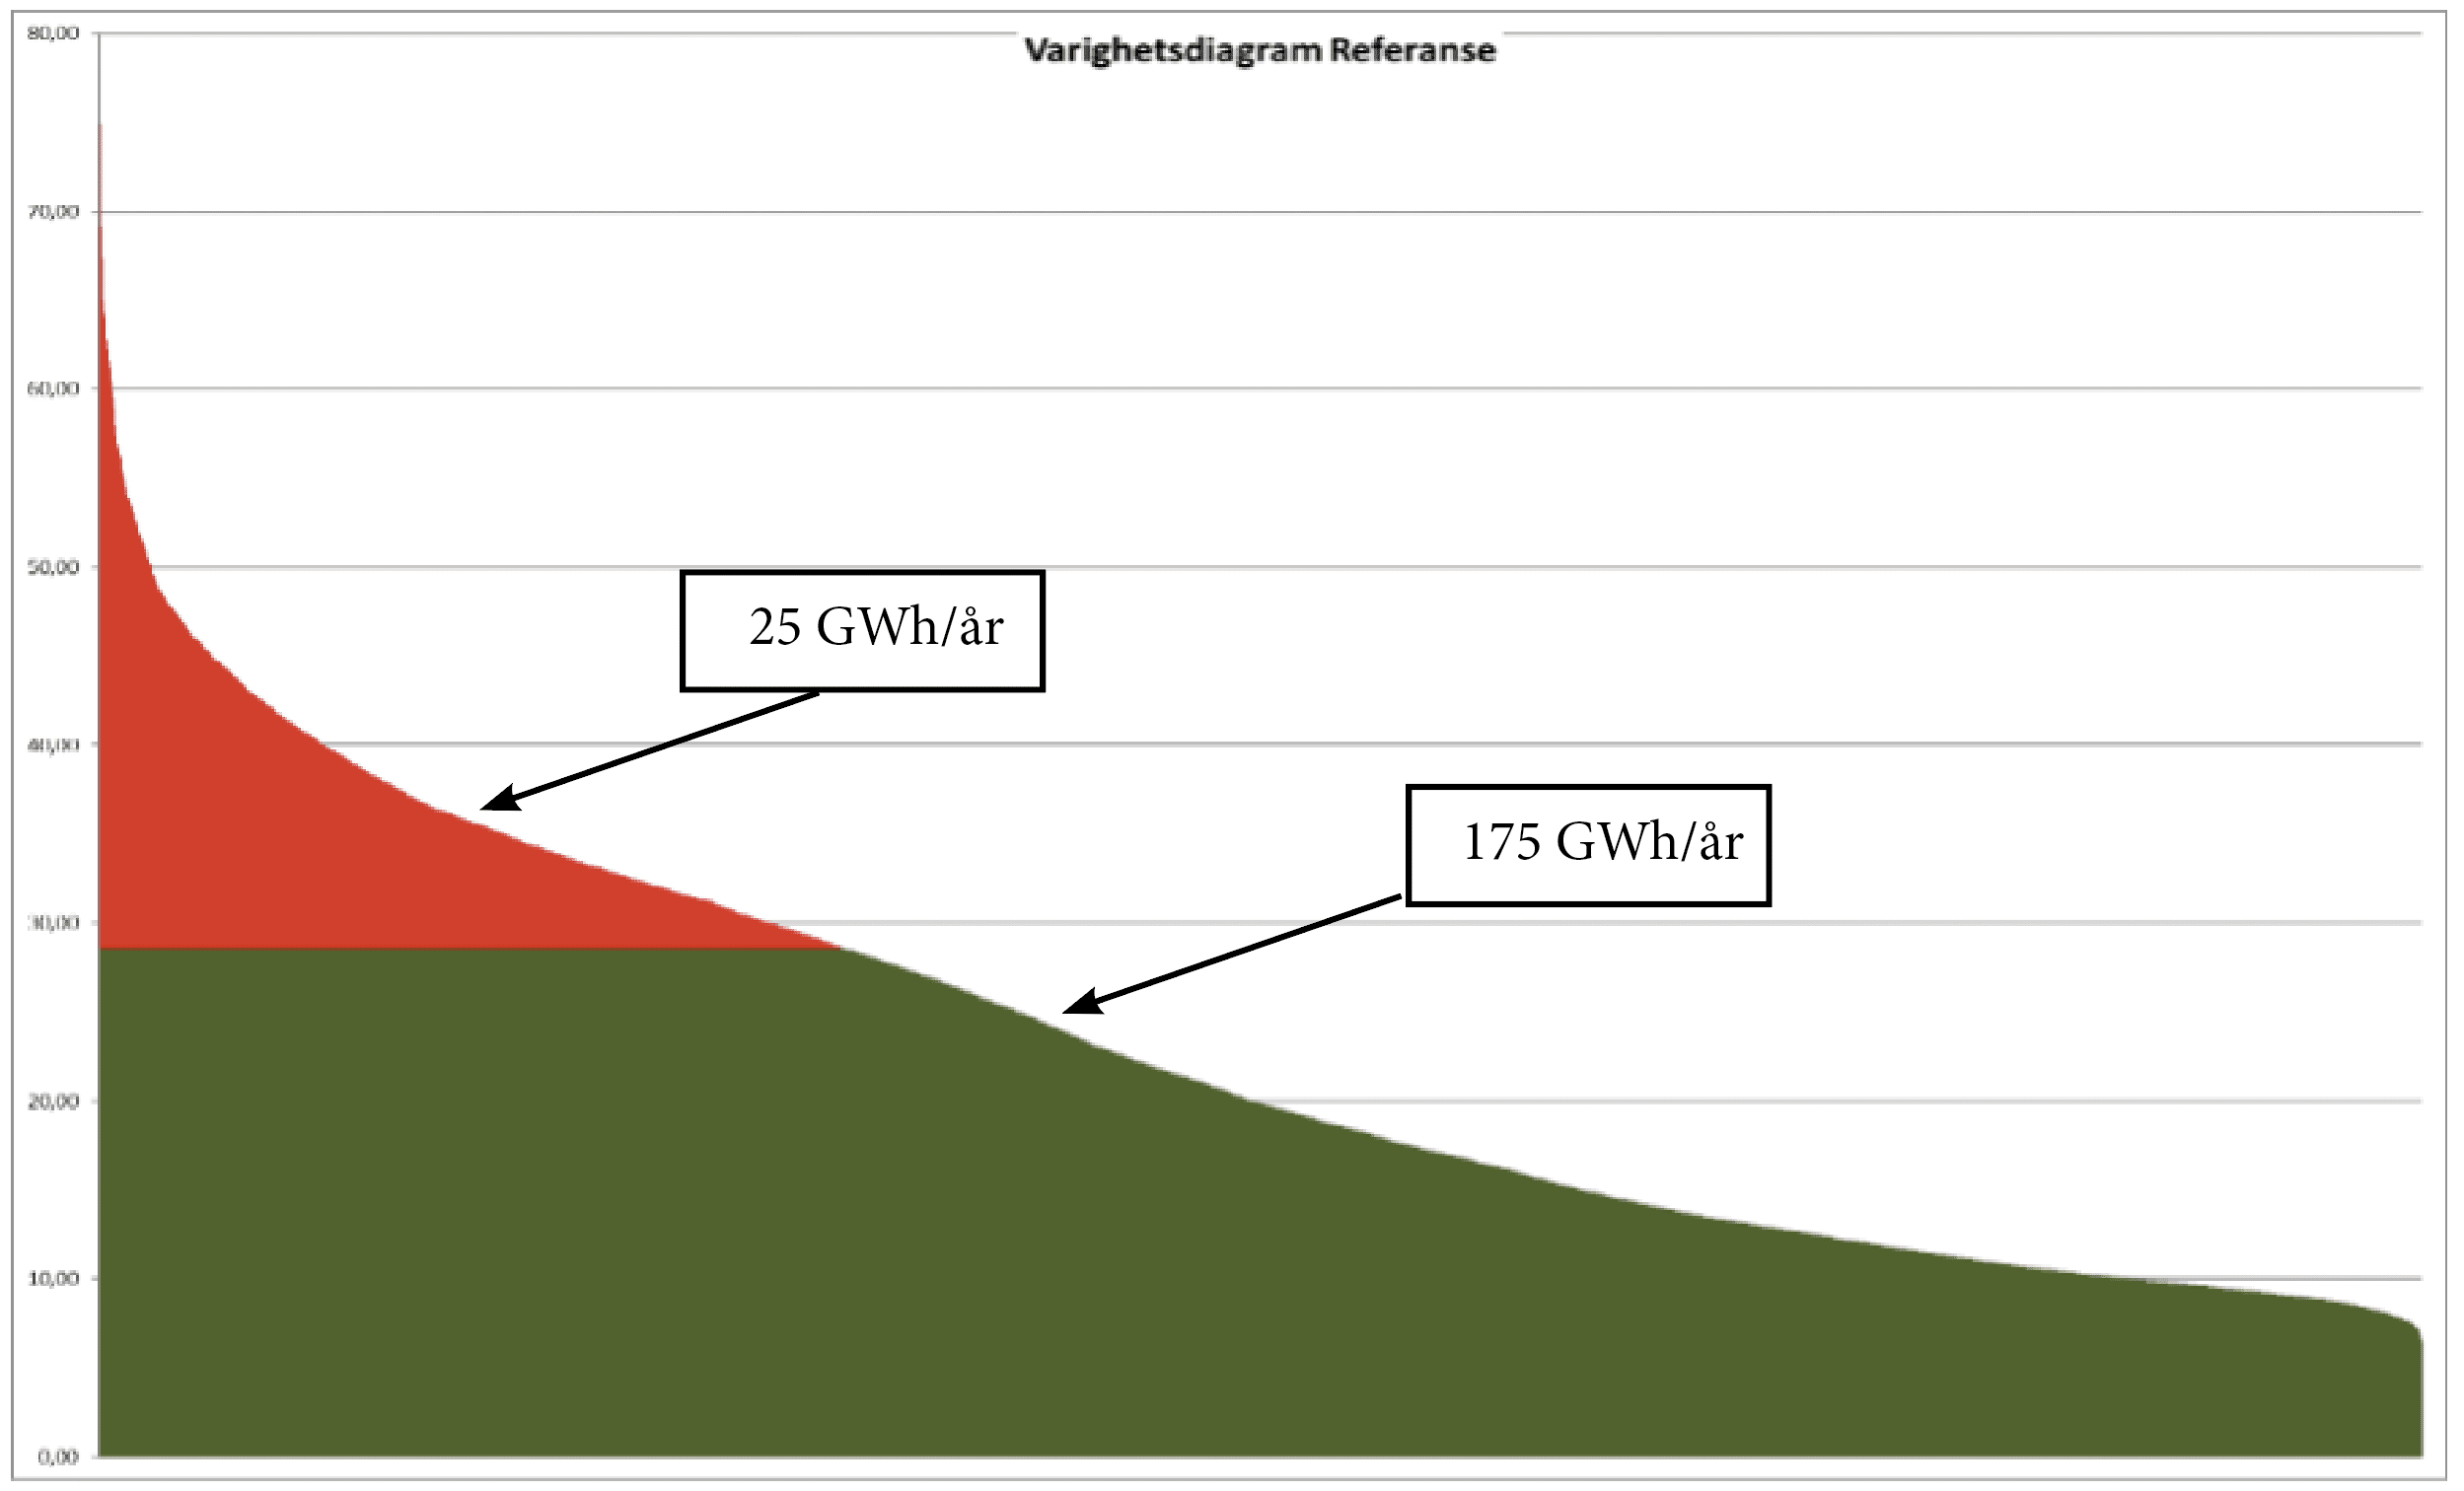
As a simplification, the peak load requirement is covered with the help of an electric boiler elsewhere in the DH network. A "smart integration" can reduce the need for the use of such an electric boiler. This means that if there is a smart integration that can cover some of the red area in Figure 2, it is a desirable solution.
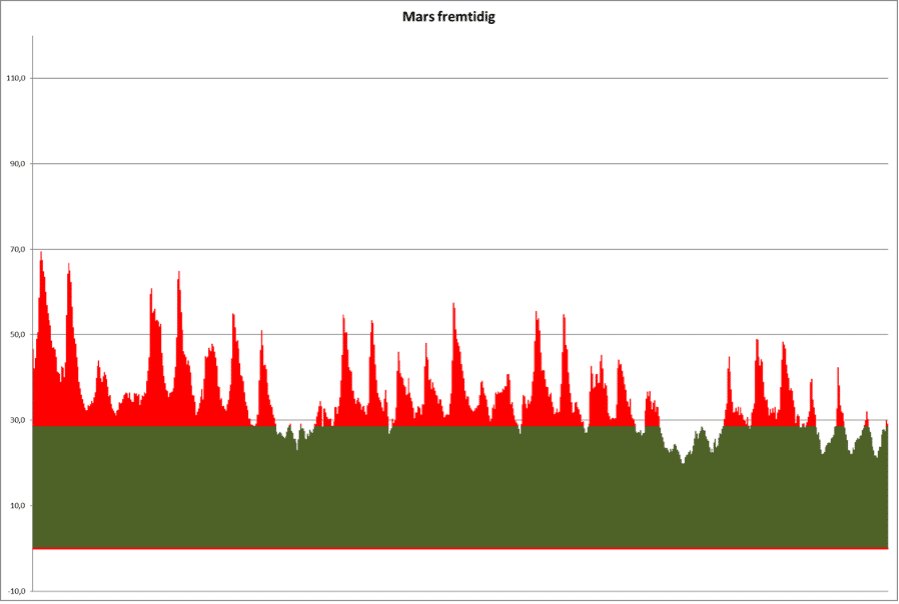
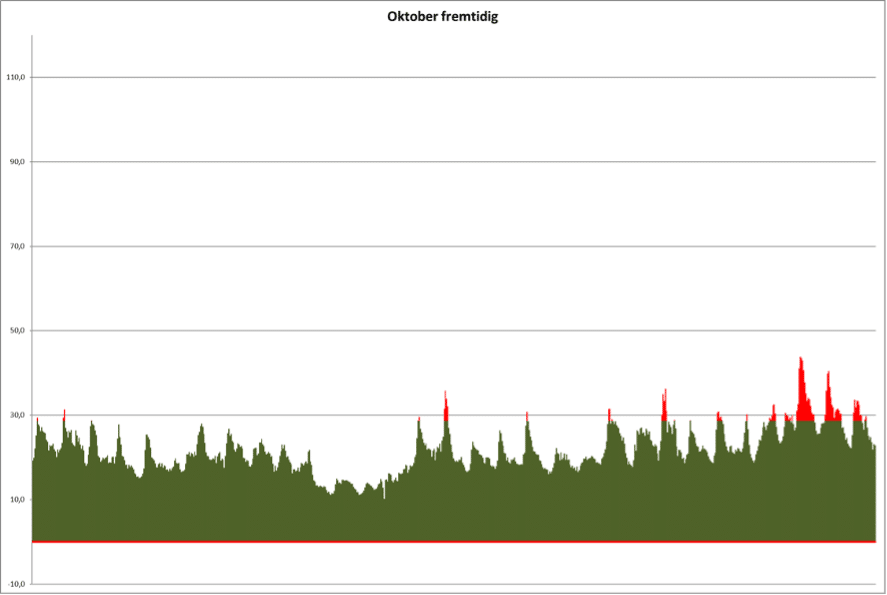
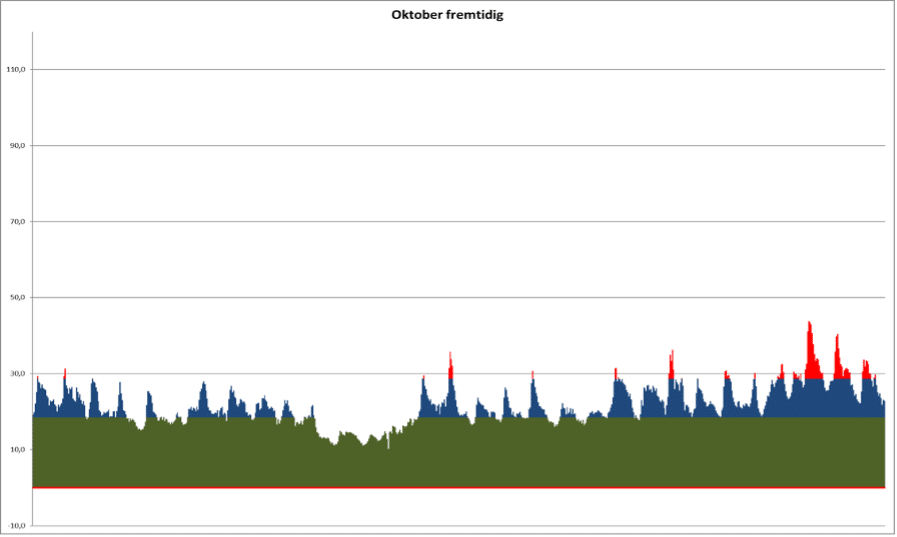
The heat load in the district heating network varies from hour to hour and season to season. Figures 3 and 4 show the unsorted data from Mars and October respectively. When the DH demand is less than the energy recovery capacity, the excess heat from the waste combustion is cooled down in local air coolers. The variations can be compensated for by plant operators adjusting circulation volumes and temperature in the DH network (accumulation), and by bypassing steam from the turbine for direct use against district heating. Such operational optimization is not accounted for in the simulations.
Dealing with the daily variations is important there - as heat pumps should be installed so as not to risk damaging the heat pumps.
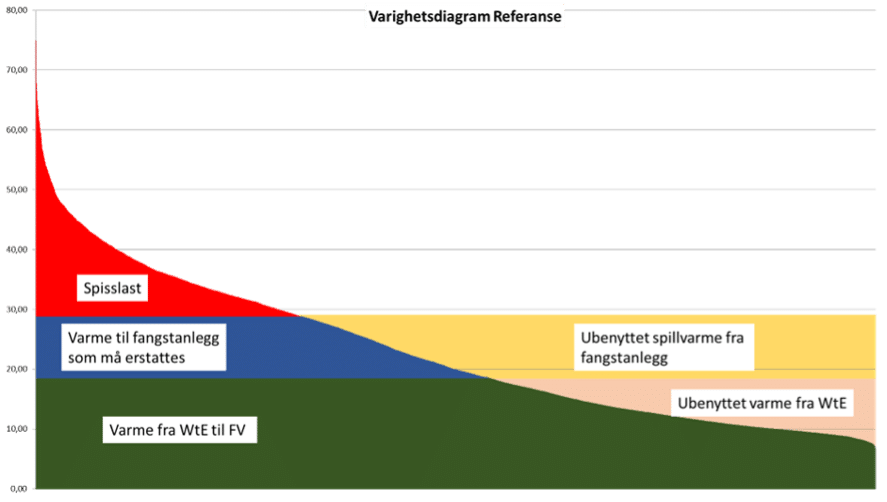
If it is assumed that the steam needs of the capture plant are met with steam from waste incineration, there will be less heat available to cover the DH requirement. The blue field in Figure 5 shows the negative effect of the capture plant on heat deliveries to DH from "KAN Referansa". The divide between the blue and green fields is 18.5 MW. The blue field can be fully or partially covered with the help of smart integrations.
Duration diagram for "KAN Referansa" with carbon capture plants without smart integrations.
The figures below show examples of hourly values in March and October, respectively. The blue field is heat that must be supplied with the help of heat integrations to maintain district heating deliveries.
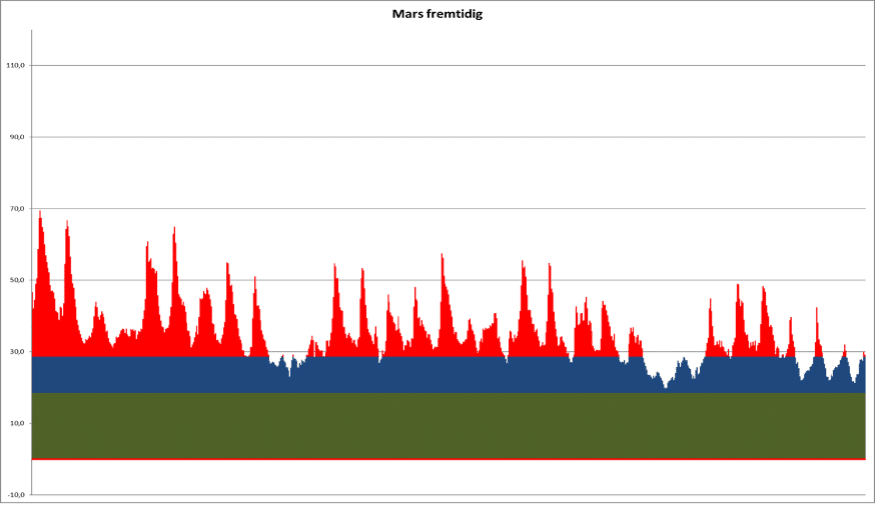
In the periods between summer and winter, there are large daily variations, which would mean that heat pumps (HP) would have to be turned on and off frequently, here accumulation options are important. Frequent starts and stops of heat pumps have been shown to significantly reduce their lifespan.
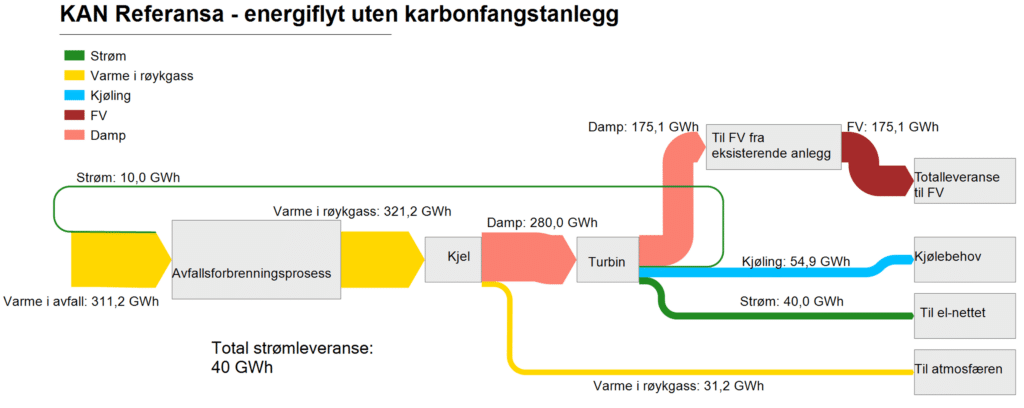
2.5.1 Energy flow - Waste incineration without carbon capture
Over the course of a year, the effects will vary greatly according to the need in the DH network. The total energy flow is shown in Figure 10, note here that it is a current that goes to cooling, which is the heat the DH grid cannot receive, typically in summer.
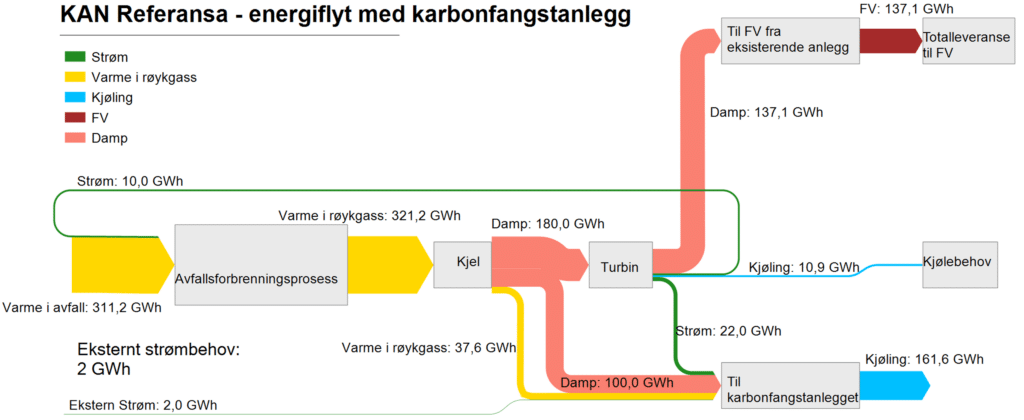
2.5.2 Energy flow - Waste incineration with carbon capture
The energy flow of "KAN Referansa" waste incineration plants with carbon capture plants without any smart integrations is shown in figure 12. It is clear that a carbon capture plant requires a lot of electrical power and heat output from waste incineration. In addition, there is a great need to cool the capture plant. Steam that must be used for capture plants leads to a significant reduction in electricity production from steam turbines, and incineration plants will therefore switch from being an electricity supplier to being a net electricity consumer. Over a year, we see that we need less cooling on the heat from the turbine, but significantly more on the heat from the carbon capture plant, as shown in the figure below.